Adult Income Prediction using Python

Introduction
In this project, we will use a number of different supervised algorithms to precisely predict individuals’ income using Adult data Set collected from the UCI machine learning repository. We will then choose the best candidate algorithm from preliminary results and further optimize this algorithm to best model the data. Our goal with this implementation is to build a model that accurately predicts whether an individual makes more than $50,000.
Data
The modified dataset consists of approximately 48,841 data points, with each data point having 15 features.
Target Variable : income (<=50K, >50K)
Import Libraries and Load Data
We will first load the Python libraries that we are going to use, as well as the adult data. The last column will be our target variable, ‘income’, and the rest will be the features.

Data Analysis
An initial exploration of the dataset like finding the number of records, the number of individuals making more or less than 50k etc, will show us how many individuals fit in each group.

Data Preprocessing
Data must be preprocessed in order to be used in Machine Learning algorithms. This preprocessing phase includes the cleaning and preparing the data.

Normalization
It is recommended to perform some type of scaling on numerical features. It is used to change the values of numeric columns in the dataset to a common scale, without distorting differences in the ranges of values.

Preprocess Categorical Features
If we take a look at the output above, we can see that there are some features like ‘occupation’ or ‘race’ that are not numerical, they are categorical. Machine learning algorithms expect to work with numerical values, so these categorical features should be transformed. One of the most popular categorical transformations is called ‘One-hot encoding’ as below.

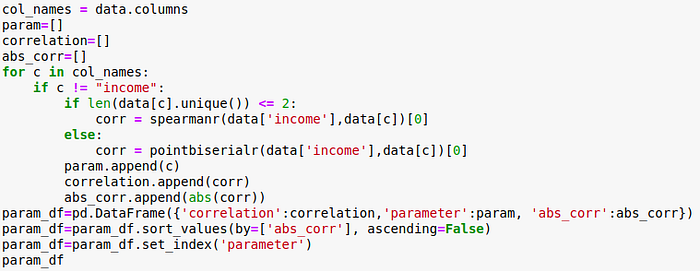
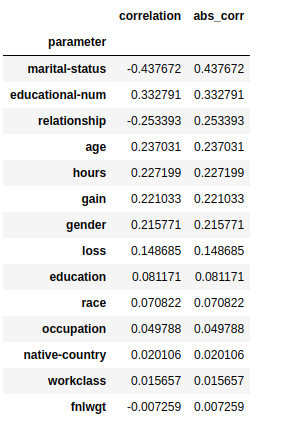
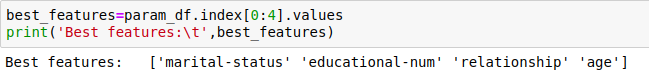
Feature Selection
Having irrelevant features in your data can decrease the accuracy of the models and make your model learn based on irrelevant features.
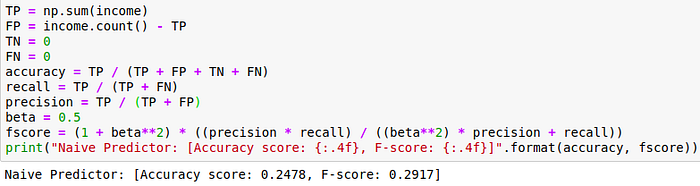
Performance Evaluation
When making predictions on events we can get 4 types of results: True Positives, True Negatives, False Positives, and False Negatives. The objective of the project is to correctly identify what individuals make more than 50k$ per year, Therefore we should choose wisely our evaluation metric.
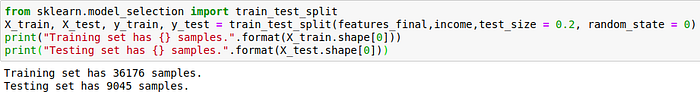
Splitting the Data
Now when all categorical variables are transformed and all numerical features are normalized, we need to split our data into training and test sets. We split 80% to training and 20% for testing.
Prediction
Some of the available Classification algorithms in scikit-learn:
- Gaussian Naive Bayes (GaussianNB)
- Decision Trees
- Ensemble Methods (AdaBoost, Random Forest,..)
- Stochastic Gradient Descent Classifier (SGDC)
- Logistic Regression
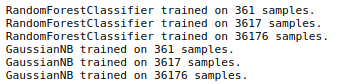
Gaussian NB and Random Forest Classifier
The strengths of Naive Bayes Prediction are its simple and fast classifier that provides good results with little tunning of the model’s hyperparameters whereas a random forest classifier works well with a large number of training examples.

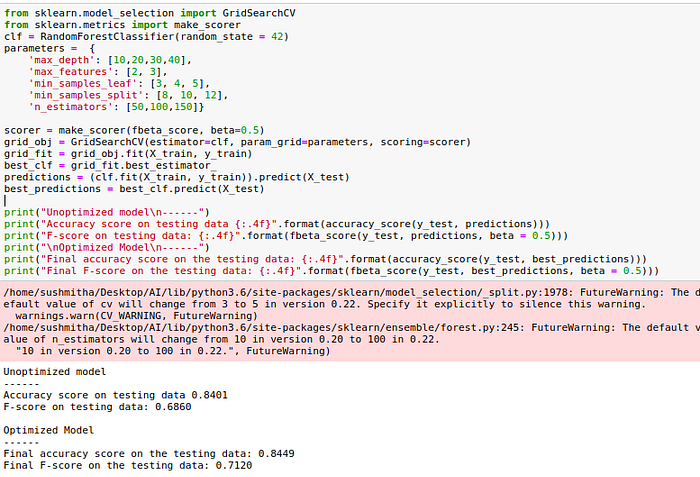
Model tuning and evaluating the performance:
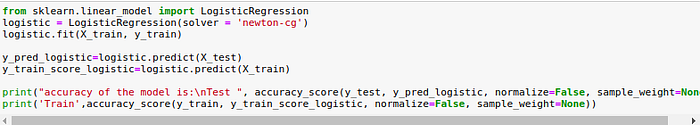
Logistic Regression
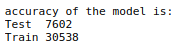
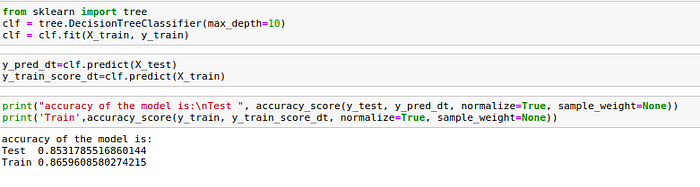
Decision Tree Classifier
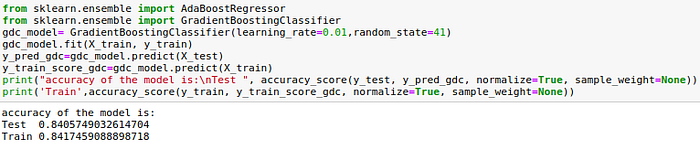
Gradient Descent Classifier
Observations
- GaussianNB: 84.01%
- Decision Trees: 85.31%
- Random Forest: 84.49%
- GDC: 84.05%
- Logistic Regression : 76.02%
The optimized model’s accuracy and F-score on testing data on random forest classifier are 84.49% and 71.20% respectively. These scores are slightly better than the ones of the unoptimized model but the computing time is far larger. The naive predictor benchmarks for the accuracy and F-score are 24.78% and 29.17% respectively, which are much worse than the ones obtained with the trained model.
Conclusion
Throughout this article, we made a machine learning classification analysis from end-to-end and we learned and obtained several insights about classification models and the keys to develop one with a good performance.